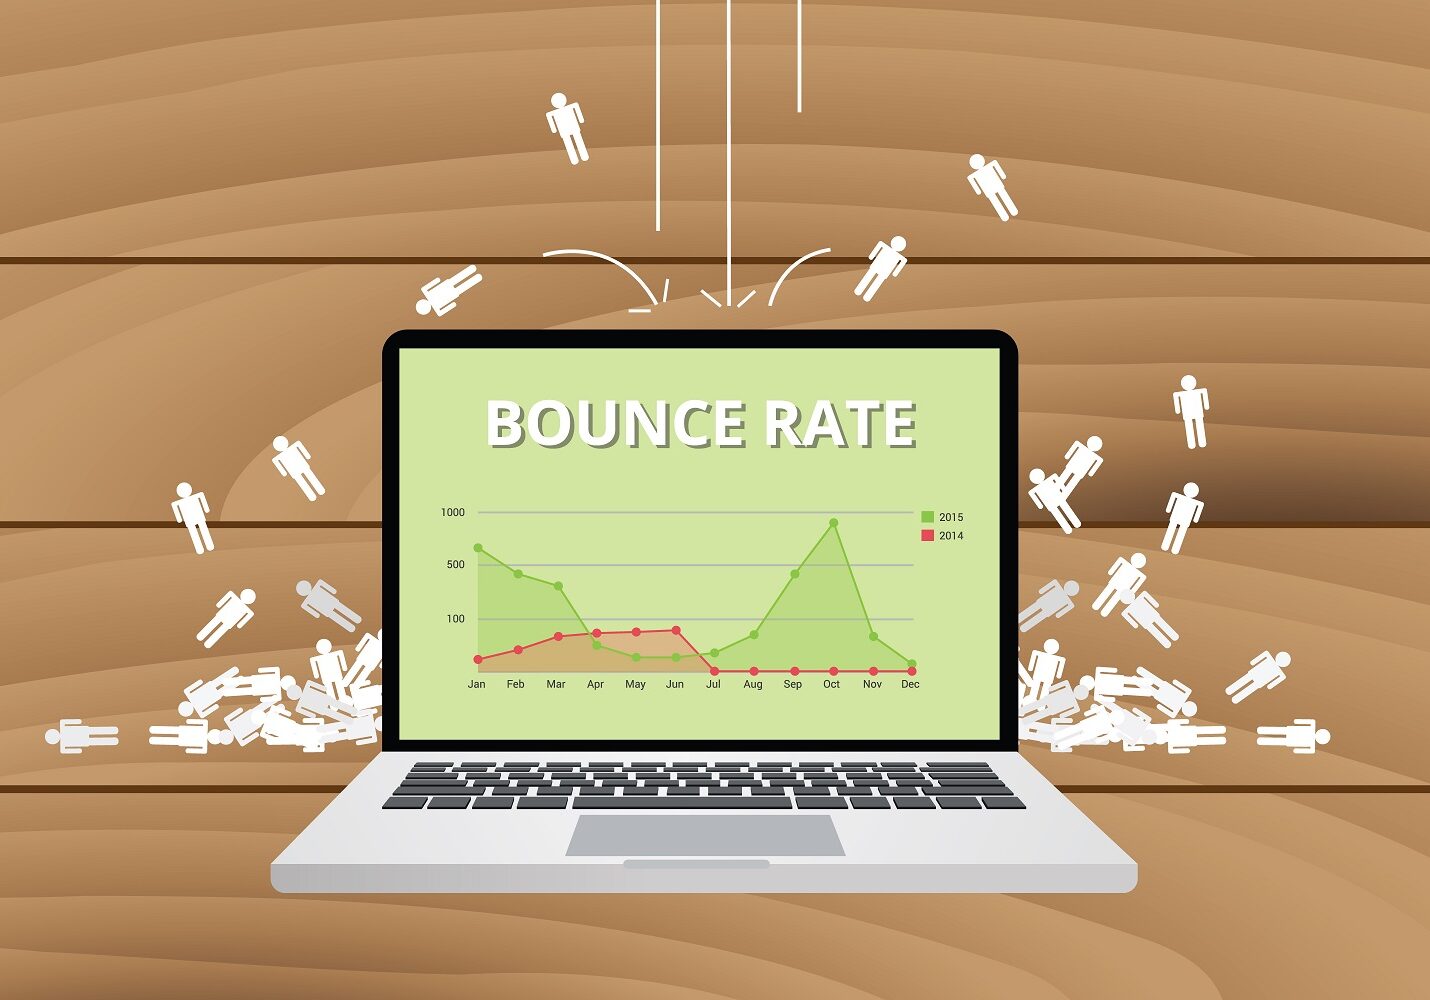
In the digital world, there are millions of clicks across website databases that seemingly never end (Ask the TikTok surfers!). Although, the measure of success for websites and advertising companies relies on the determination of a "bounce rate" to help understand the longing interactions and connections with their cyber visitors.
A bounce rate can help website managers and business owners know how their content is holding customers' attention. A high bounce rate is unwanted by website owners and their associated companies, typically resulting in an overview of electronic analytics; including personalized styles, layout/navigation, and written content that drives the user experience behind the digital content. For a web page to make improvements aimed in the right direction of decreasing bounce rates, it is vital to evaluate the page views and typical session lengths on the page.
How Do You Calculate a Bounce Rate?
Now that you know what a bounce rate is, it is important that you know how to calculate them on your own website. While there are many ways to do this, depending on your preferred reporting choices, we will look at the two most common ones.
-
By Website Page Views
Do you want to know how many users visit and exit your site without looking at a second page? While this can occur for many reasons, this method calculates the bounce rate by looking at the total number of bounced sessions and then dividing it by the total number of sessions registered by the website.
-
By Unique Session Length
As the name suggests, this method of calculating a bounce rate looks at how long users spend on each page they visit on your website. Session lengths will begin timing the user from the moment they land on a specific page until they leave or click on another link. For some websites, this may be a more helpful way of determining how effective content might be.

Calculating Bounce Rates with Google Analytics
When used correctly, Google Analytics is more than just a resource for calculating and improving bounce rates. In fact, this free tool can often help you completely transform your user experience and pinpoint any issues that are occurring. That means your website’s visitors can find what they need faster and more efficiently.
Google Analytics also allows website owners to refine further the variables used to calculate their own unique bounce rates. To provide a clear picture of the overall performance of individual pages and the website as a whole, some of the factors that should be tracked for the best results include:
How Do You Calculate Bounce Rates in Google Analytics?
To view your bounce rates in Google Analytics, you will first want to sign into your Dashboard and click the “Behaviors” option on the left side of the screen. Once you have done this, you should see a falling menu that provides access to a “Site Content” tab. When you click this, you should see these options:

To see your bounce rates, you will want to choose the “Landing Pages” tab. This will show all of the landing pages designated in Google Analytics and their unique bounce rates. One benefit of this reporting is that the user can compare pages against each other to see how they are performing.
To the right, you should see a “Bounce Rate” header that allows you to view a percentage-based bounce rate for any pages you have registered as landing pages. You can also access additional tabs that provide information for “Average Time on Page” and “Page Views.” Together, these can all give you unique insight into your page performance.
To help you get a little more insight into what these numbers mean, shorter session lengths mean that visitors aren’t spending a lot of time on your page, and some adjustments might be necessary. A decrease in page views could mean that your content isn’t optimized correctly, and you might not be getting the exposure you could if you focused on Search Engine Optimization.
If you struggle to calculate your bounce rates, Maennche Virtual CMO can help streamline the process and provide you with in-depth monthly reporting. With this information, you can make informed decisions on what improvements need to be made, or you could offload these tasks to our capable team of marketing professionals.
How Can Google Analytics Improve Bounce Rates?
The Google Analytics dashboard provides access to navigate "behind the scenes" of your website. The GA digital access allows you to register web pages for bounce rate calculations. This assistance allows you to understand better how your digital content reaches users, in other words, how successful your website/business web page is. Google Analytics also provides site content management options with a variety of information for your website.
The information involves calculating totals of page visits, bounce rate, page views, individual bounce rates, average session length, favorite users, unique sessions, and more. Google Analytics will help to redefine the way you monitor your website and make improvements to user experiences. Live data averages of interactions are displayed through legible graphs and timelines when using the Google Analytics support system; This information can be easily interpreted by staff and business partners for further collaboration efforts and digital content creation.

What is the Difference Between Bounce Rates and Exit Rates?
Simply defined, a bounce rate is calculated as a web user enters and exits immediately from your webpage without interacting with the site at all. Exit rates consider a broader calculation in which the number of users who leave your website is compared to the total number of views for the web page itself.
Confusing the two rate calculations is common due to the similarity between the two definitions. However, think about bounce rates being more particular metrics versus a broader understanding of the exit rates. Bounce rates help to determine a possible aesthetic issue involving layout, color, content, etc. In contrast, exit rates help understand how people view your page as a whole rather than a particular page within the entire website.

Why Should You Track Your Bounce Rates?
The value behind a bounce rate is priceless when determining the improvements in your website performance. The impact of tracking bounce rates can help reveal trends in user navigation across website pages. This feature holds its worth due to the importance of finding prospective users and future interests in media content.
Your personal or professional website can be reshaped and recreated by improving website design and other digital aspects that help market attractable media content. Are you tracking your bounce rates yet? This metric system allows you to take a closer look at your content on each page of your site to help optimize the space and directly impact the viewing audience.
How Can You Create Engaging Content?
The key is to consider the interests of the target audience you intend to reach. You must produce engaging and intriguing content for users to escape with, whether with food and cooking, life and family, traveling, or any other reason for creating a website. The content that you produce should be targeted to be of high quality across all features of content.
Use Better Images
- Content should be published with some form of photo piece. This creates a visual for the content and serves as an attention-grabbing tactic.
- Create your content by taking your images. This provides a uniqueness to your website.
Focus on Keywords
- You should make your message clear through your content and answer frequently asked questions upfront through your website information. Users want to understand what they can expect from your content quickly. Google Analytics also includes services for finding trending business keywords through the Google Keyword Planner to help guide content creators throughout their digital content pages.
Verify Your Branding
- Recognize the significance of your brand colors and style for your website. Some web designers designate meaningful colors and names based on the purpose behind the network being advertised. For example, a man named his coffee business after his wife's favorite color. You want your branding to be meaningful and memorable to others as well.
- Do not overwhelm the audience with too many logos or too much information. It can be easy to clutter websites with all of the digital features nowadays online, but straightforward marketing techniques will always work best. Show viewers what you offer and how to get there (click, buy, read, etc.) and watch the magic happen! Don't forget that Google Analytics can help you improve the user experience across your website content!
- Emphasize the main idea of the website and keep distractions to a minimum. You want your content to be like no others… right?! Make it happen by avoiding general terms and making them more specific to your audience and the content you provide. Develop a name people can trust and present a consistent and user-friendly environment for all.
Ready to Get Started?
Maennche Virtual CMO relies on detailed reporting to ensure clients' content marketing strategy remains positive and meaningful to their viewers. We will provide you with updated technology and strategic marketing through systematic metrics like Google Analytics. Our teams work diligently to create engaging content that has the power to expand throughout local and distant communities. With years of experience, our Maennche VCMO will be happy to assist you by creating, managing, and analyzing relevant content that resonates with your brand.
